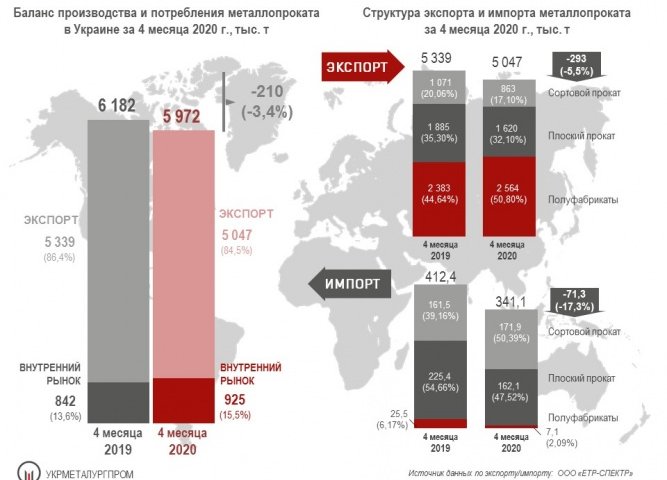
According to Ukrmetallurgprom, for 4 months of 2020, Ukrainian metallurgical enterprises produced 5.97 million tons of rolled metal (96.6% compared to the same period in 2019), of which, according to ETR-Spektr LLC , exported about 5.05 million tons, or 84.5%. In the same period in 2019, the share of exports amounted to 86.4% (5.34 million tons with a total production of 6.18 million tons of rolled metal).
The share of semi-finished products in export deliveries for 4 months of 2020 accounted for 50.80%, which significantly exceeds the indicator for the period January-April 2019 (44.64%). The share of flat-rolled products in export deliveries for 4 months of 2020 is noticeably lower than the indicator for the same period in 2019 (32.10% and 35.30%, respectively). The same picture is observed in relation to long products - 17.10% in 4 months of 2020 versus 20.06% in 4 months of 2019
In January-April 2020, 1266.1 thousand tons of rolled metal were supplied to domestic consumers, of which 341.1 thousand tons, or 26.9%, were imported. For the same period in 2019, the domestic market consumed 1254.4 thousand tons, of which 412.4 thousand tons, or 32.9%, were imported. Thus, for 4 months of 2020, there is an increase in the consumption of rolled metal in the domestic market by 0.94% compared to January-April 2019, with a simultaneous decrease in the share of the import component by 5.9%.
The structure of imports for 4 months of 2020 is characterized by a noticeable dominance of long products over flat ones (50.39% and 47.52%, respectively); In the same period of 2019, flat-rolled products dominated over long-range products (54.66% and 39.16%, respectively).
The main export markets of Ukrainian metal products in January-April 2020, according to ETR-Spectr LLC, are the countries of the European Union (31.0%), other European countries (14.5%) and Africa (13, 2%).
Among metallurgical importers for 4 months of 2020, the first place is taken by the CIS (44.6%), the second by the EU-28 (25.2%), and the third by other European countries (14.9%).